

After every Celtic game this season, The Cynic will publish a Match Centre exclusively for subscribers breaking the game down in numbers and illustrations through our custom-made graphics. In this edition, we look at Celtic’s 2-1 win over St Mirren. You can open each image in a new browser to see a larger image to provide the full detail.
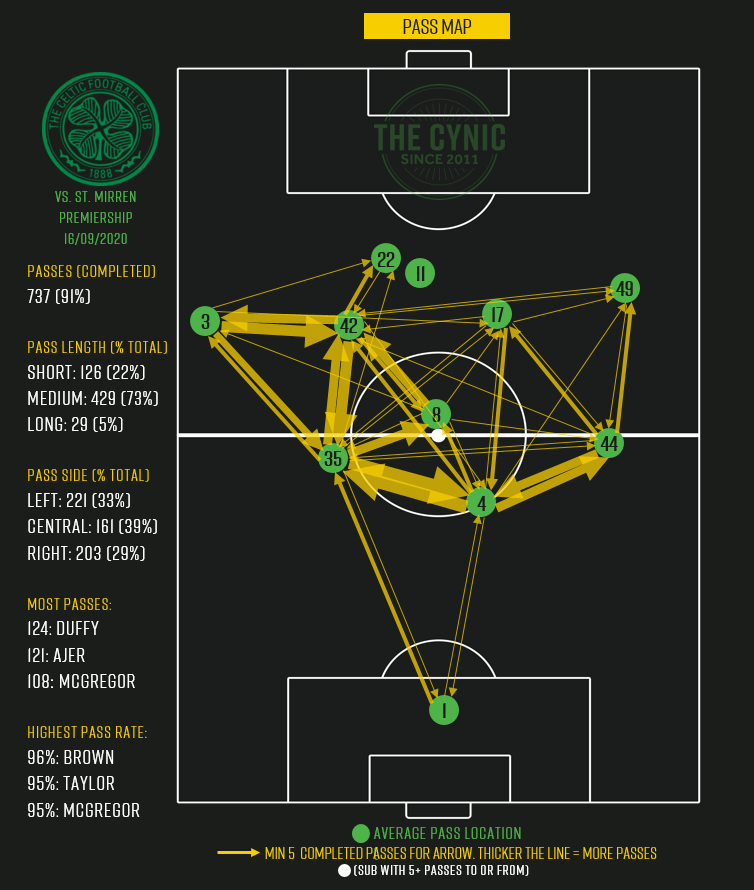
The Pass Map shows the average pass location for each Celtic player and any substitute who made or received five or more passes from the same teammate. Shane Duffy 124 passes. Kristoffer Ajer 122. Add Hatem Elhamed’s 77 and Celtic’s centre-backs attempted 323 of Celtic’s 737 passes against St.Mirren, which gives a good insight into the team’s struggles to find space and opportunities for quick attacks against the St Mirren’s low block. For comparison, Celtic’s highest passer on average, Callum McGregor, has only exceeded Duffy’s total passes eight times in his previous 138 league games, going back to Brendan Rodgers’ first season in charge.
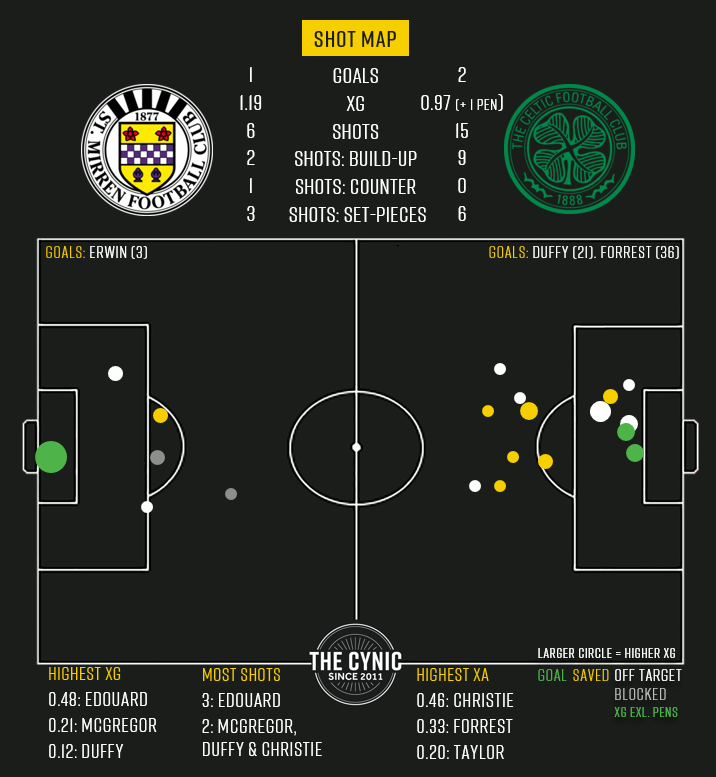
The Shot Map illustrates the quantity (shots) and quality (xG) of Celtic and St Mirren chances. According to InStat, Celtic lost their first (non-penalty) xG match of the year, 1.19 to 0.97. With the penalty, Celtic are ahead (pens have a set value of 0.75xG in InStat) but it’s not something we usually include in the xG total as the aim is to give an illustration of the underlying performance of the match, i.e. the ability to create chances and to avoid conceding them. With Celtic winning the shot stats 14-6, if you exclude Odsonne Edouard’s missed penalty, it is one of the most unique examples I’ve seen of a team dominating in the volume of chances but ‘losing’ in quality. It’s also solely down to St. Mirren’s close-range opener, which was given an xG of 0.91. All this is a timely reminder that single-game xG, even if it is usually a more accurate representation of the performances in a game compared to shots taken and especially goals scored, it needs to be taken in context – as with always, solid conclusions should only start being taken from a much larger sample.
But there is no escaping the fact that outwith the penalty, Celtic again struggled to create high-quality chances against a low block, and was back to taking more shots from outside the box

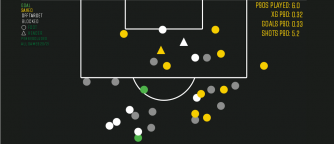
The Attack Map illustrates how and where Celtic attacked, especially in open play. In stark contrast to the game against Ross County, St. Mirren’s very low block allowed Celtic to play and attack a lot more through the middle; 35% of open play attacks and 40% of passes through the middle lane is a season high on both accounts. It’s also the first time this season Celtic’s highest passing zone was in the middle of the pitch: in fact 24% of Celtic’s open play passes came in the two middle zone directly in front of St. Mirren’s box. It was a space the home team were happy to give up as they managed to restrict Celtic from converting that possession into high quality chances.
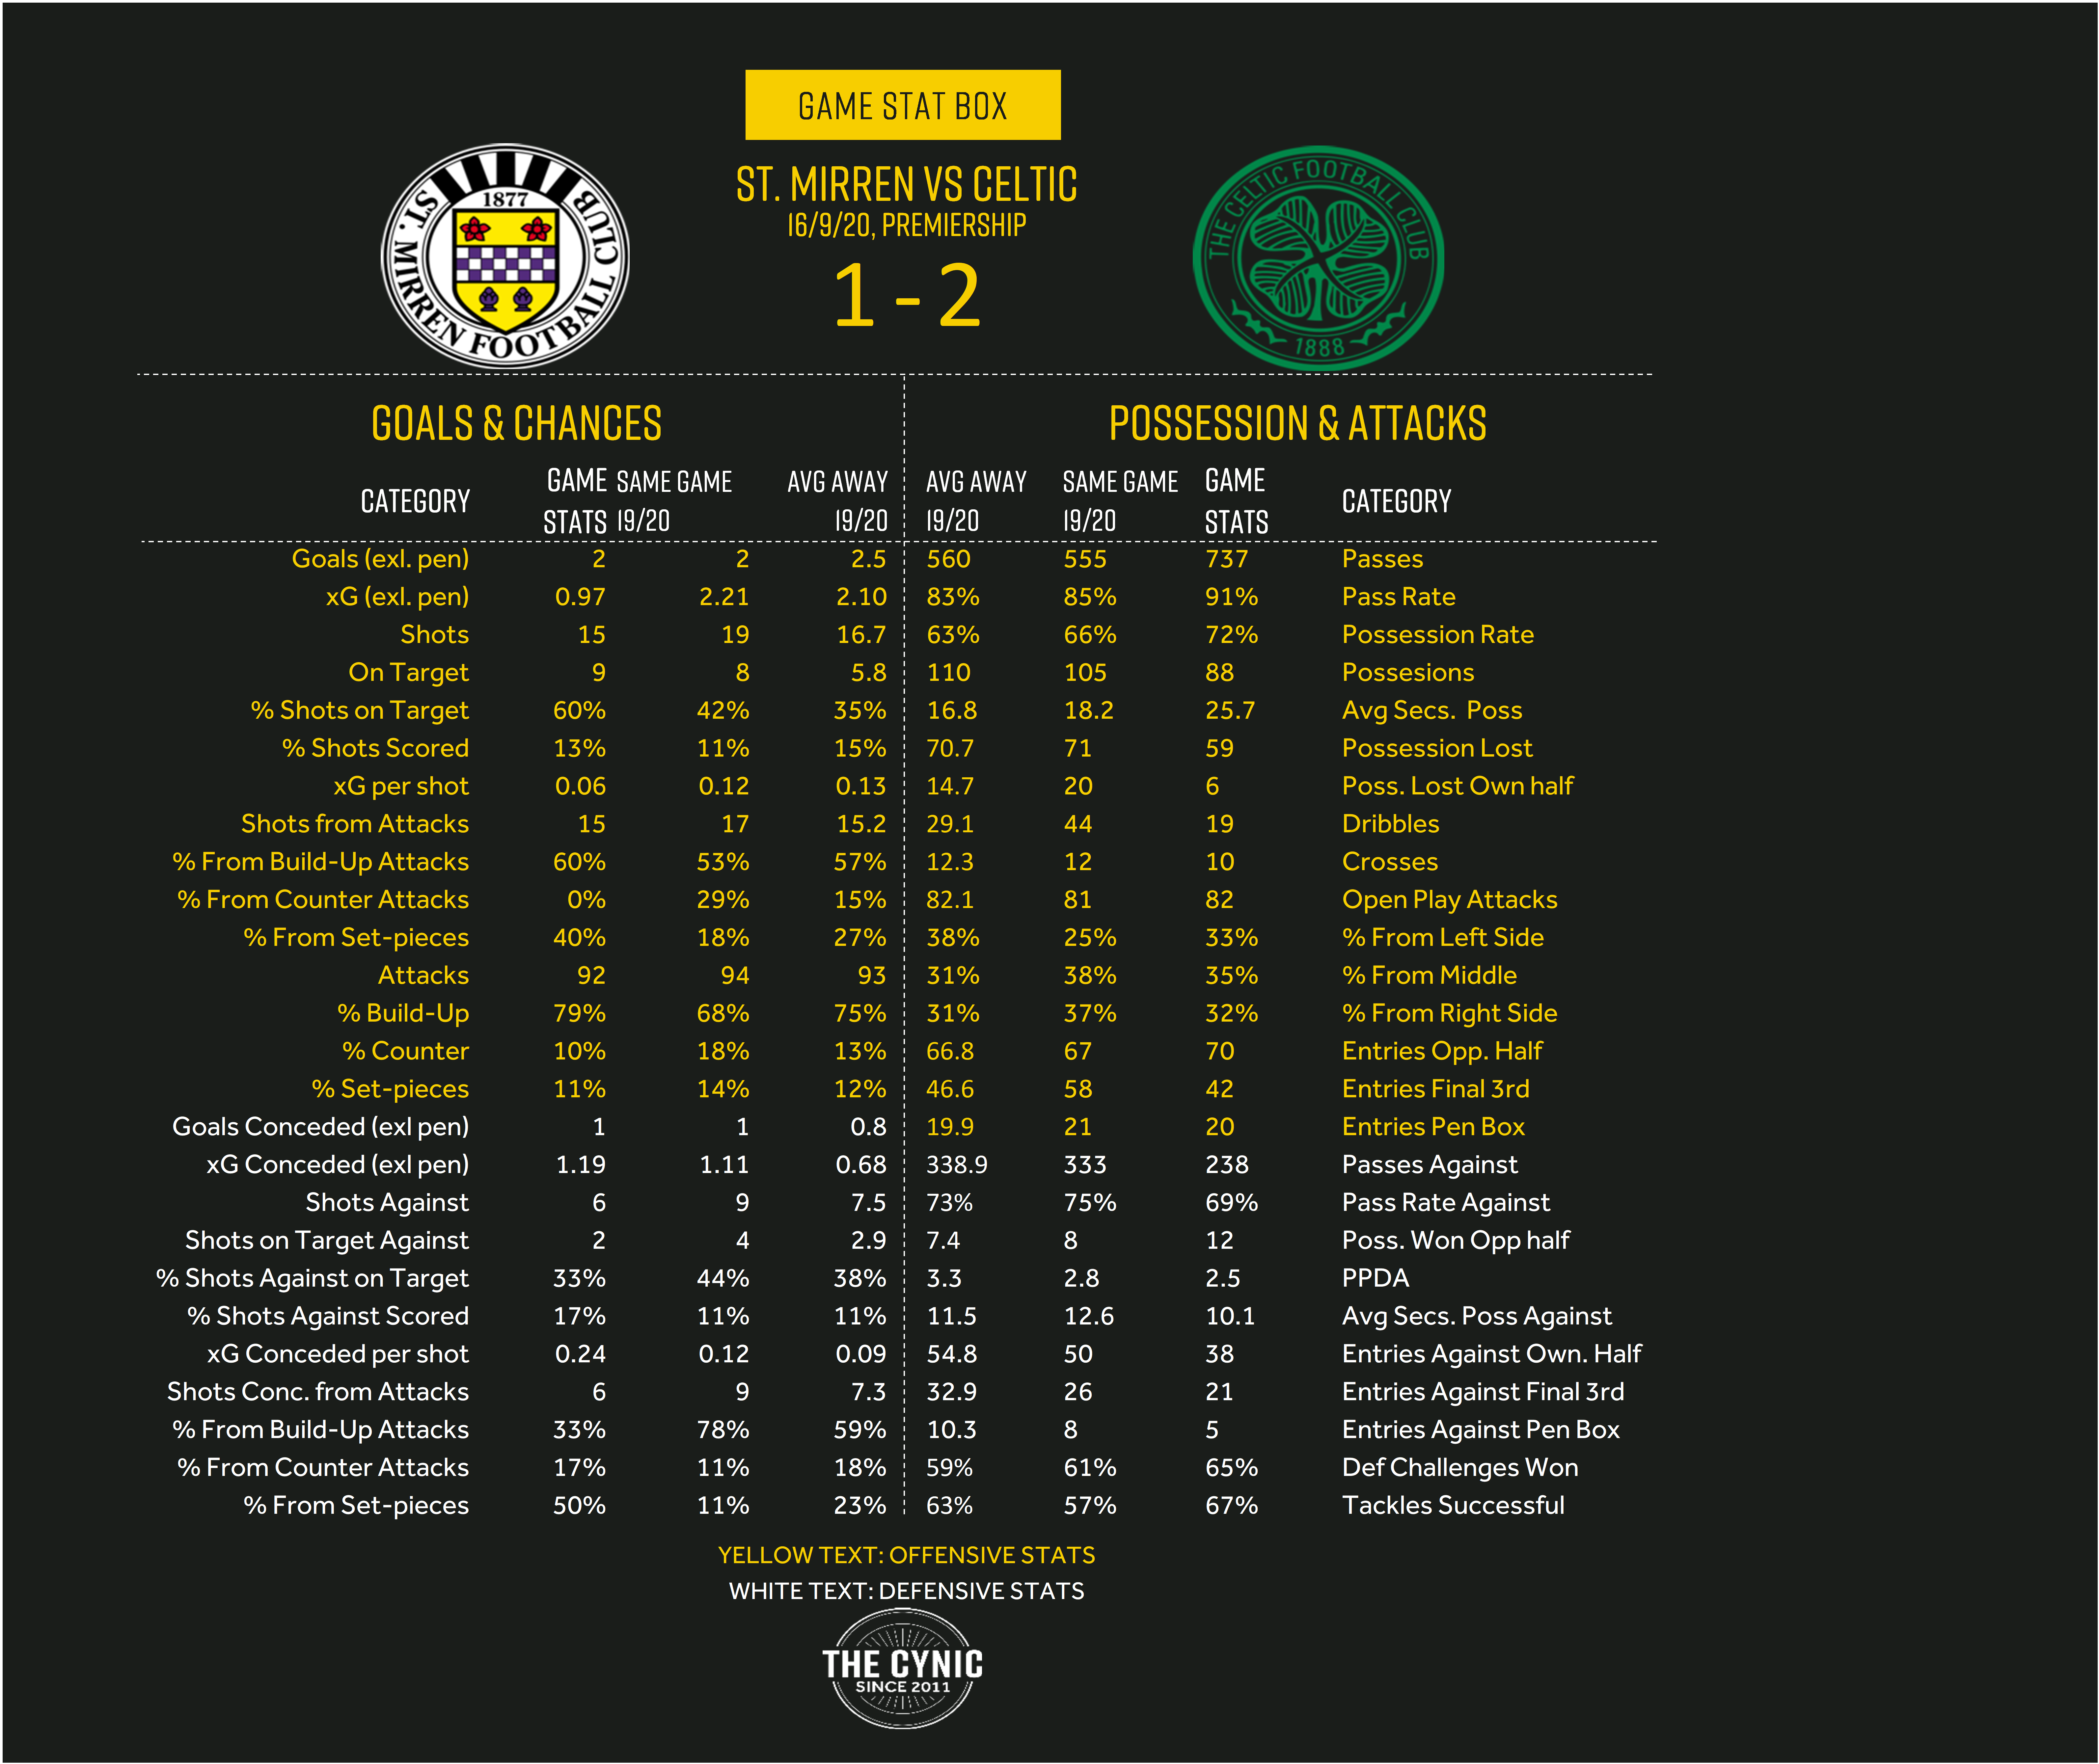
The Game Stat Box details over 50 different statistics from the game, comparing them both with the equivalent fixture last season and the 2019/20 league average at home. Comparisons to last season’s match against St. Mirren are interesting; it’s the same result and Celtic conceded only 0.08 xG less that game. The real differences are in attack; While Celtic created 2.21 non-pen xG last season, it was only 0.97 on Wednesday. 40% of shots taken came after a set-piece, while it was 18% last time. In December’s match, each of Celtic’s possession lasted on average 18.2 seconds – that increased to 25.7 sec, a 30% increase. The increase in possession is seen in an increase of almost 200 passes, and as successful passes increased by 6% points, it’s safe to conclude that the majority of those passes were less than effective in creating chances.
We hope you are enjoying the Cynic Match Centre and will continue to develop this using the raw data available after each Celtic match. Let us know using the comments below what you think of the data and graphics above and if there is anything else you would like to see us develop.


I’ve been looking forward to this and it is a very interesting read, great work yet again guys. It is really adding value to my understanding of Celtic this season.
It feels like the stats back up what the eyes told us – it was a grim performance where we struggled to create.
The eyes told us that our wing backs offered little, and the pass map shows Forrest had little involvement. Taylor was more heavily involved but his outgoing passes mainly went to Ajer and McGregor, not our attacking players.
This pass map shows Klimala was not involved. It also highlights that our midfield was not coherent and how little passes went in to Christie – and nothing came out from him in an attacking sense.
I would expect Christie to be our main attacking midfielder yet he has little or no passing interaction with either of the strikers. Or even with McGregor, who shows up as the fulcrum of this side.
There has been a lot of excitement about 3-5-2, and a feeling among many fans that it is the answer to all our worries. However what is really worrying to me is that while we won handsomely at Ross County, this is the second game we have played 3-5-2 and our midfield has not really worked. I’m sure you will have plenty to say on The Analysis but I’d be interested in your views on whether this is a problem and if it is, what we can do to resolve it (Brown for Ntcham?).